

Project Budgeting
Stay on top of your development costs
Build budgets, track costs, and monitor key financial metrics.
Part of the Groundbreak IQ project workspace.
Wynwood Arts Residences · Budget
Total budget
$74,042,000
Total spent
$42,524,000
Remaining
$31,518,000
% complete
57%
of total budget spent
- Land Costs$13,432,00018%
- Hard Costs$44,010,00059%
- Soft Costs$11,200,00015%
- Financing Costs$5,400,0007%
The problem
Your pro forma lives in Excel. Your actuals live in your inbox.
A bid comes in $400K over. You know it matters, but you won't know how much until someone rebuilds the model — and by then two more numbers have moved.
Groundbreak keeps the development budget inside the project itself, next to the team issuing the RFQs and the milestones the money is chasing. Change a number and every total it touches is already recalculated — the category subtotal, the development cost, cost per foot, cost per unit.
What it does
A budget that keeps up with the project.
Four things the spreadsheet was never going to do.
Wynwood Arts Residences · Budget
- $13,432,00018%
Land Costs
Land Acquisition · Closing Costs
- $44,010,00059%
Hard Costs
GMP Contract · Owner's Direct Costs · Hard Cost Contingency
- $11,200,00015%
Soft Costs
Architecture & Engineering · Permits & Impact Fees · Legal · Soft Cost Contingency
- $5,400,0007%
Financing Costs
Loan Origination Fee · Interest Reserve · Construction Loan Interest
- $74,042,000
Total development cost
Category and project totals are always summed from the line items — nothing is stored back.
Wynwood Arts Residences · Budget · Line items
- $7,728,000100%
Land Acquisition
$7,728,000 budgeted · $0 variance
- $6,116,000107%
Closing Costs
$5,704,000 budgeted · ($412,000) variance
- $17,505,00045%
GMP Contract
$38,900,000 budgeted · $21,395,000 variance
- $42,524,00057%
Total development cost
$74,042,000 budgeted · $31,518,000 remaining
Spent figures. Past 90% of a line turns amber; past 100% turns red and the variance shows in parentheses.
Wynwood Arts Residences · Budget · Metrics
$ / Unit
$308,508
$177,183 spent
$ / SF
$349.25
$200.58 spent
- 240
Units
- 212,000 SF
Gross square footage
- $74,042,000
Total development cost
The label follows the asset class — Units, Keys for hospitality, Beds for healthcare. With no square footage or unit count recorded, the panel says so rather than showing a number.
Wynwood Arts Residences · Budget allocation
- Land Costs$13,432,00018%
- Hard Costs$44,010,00059%
- Soft Costs$11,200,00015%
- Financing Costs$5,400,0007%
Allocation only — how the budget is split, not how much of it is spent. The line-item bars carry that story.
See it in the product.
The budget as it appears inside a live project workspace.
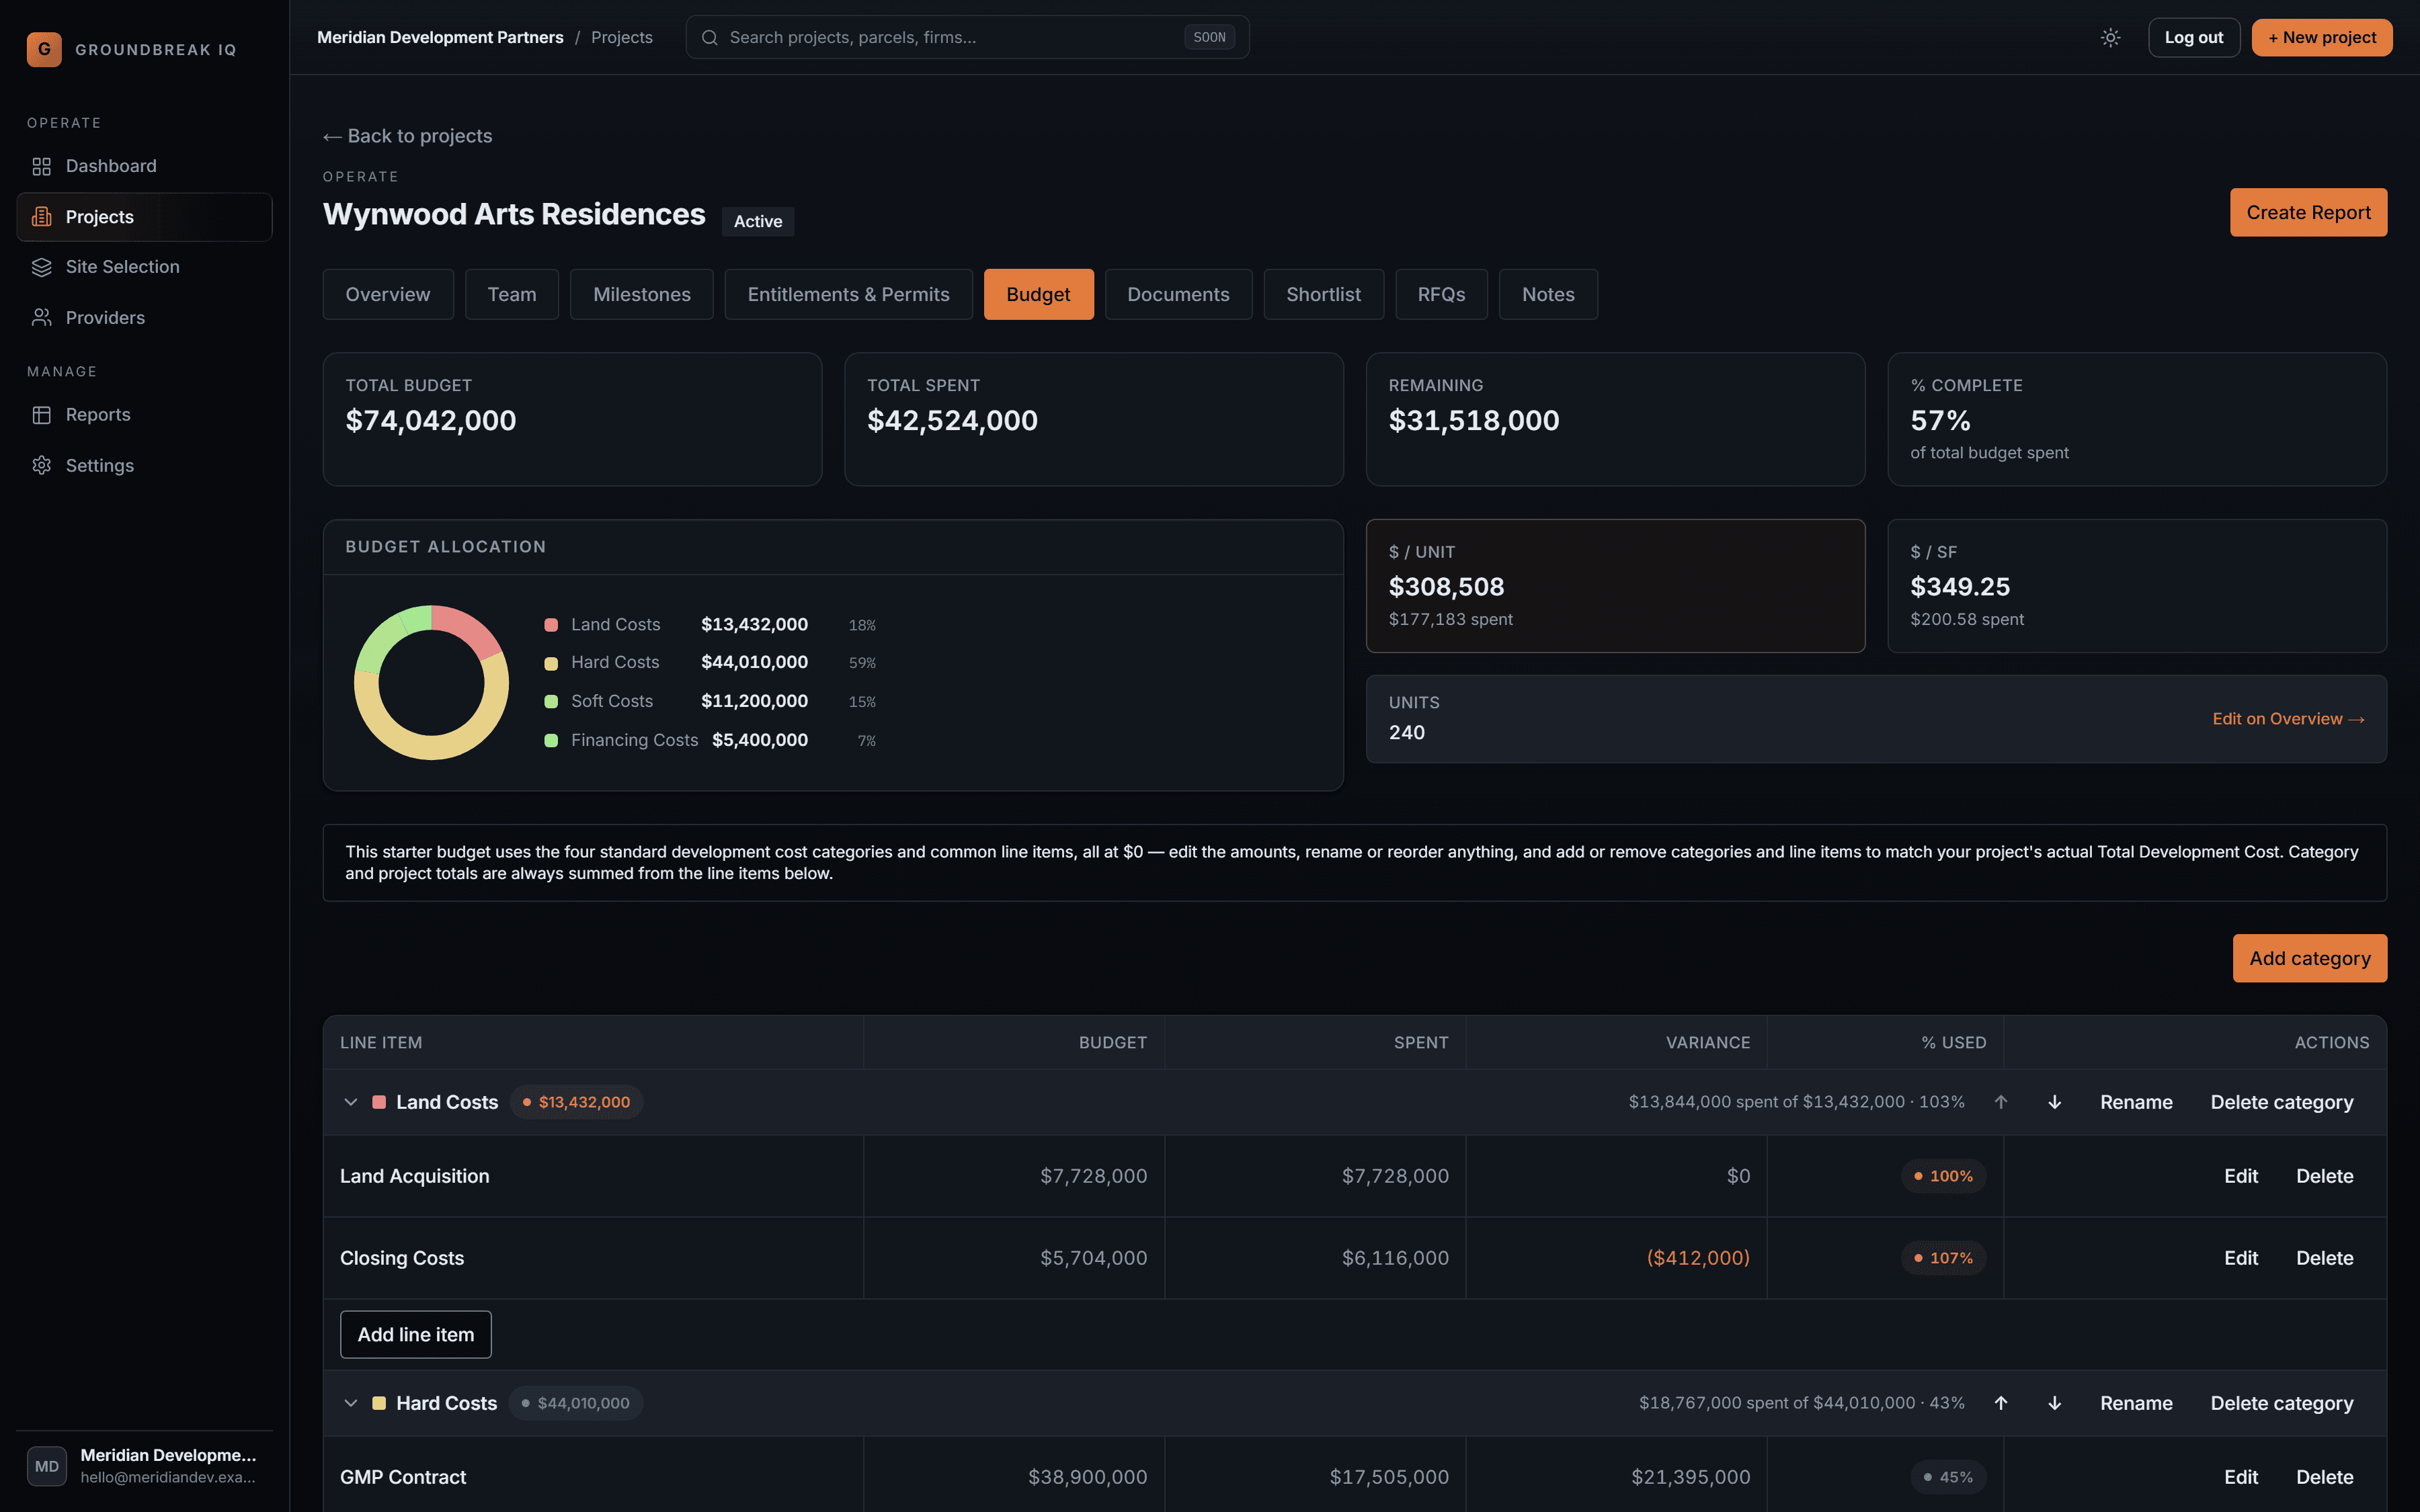
The Budget tab: totals, allocation, normalized economics and the line-item grid — one screen, all summed from the lines beneath.
Put the budget where the project is.
Groundbreak IQ keeps your development budget next to the team, the schedule, and the bids that move it.